Debugging Failing CI/CD Builds
Dealing with Failure
Sometimes when executing builds remotely on a CI/CD server, there will be failures. After navigating to the Pipelines page for the given project, you can see the status of all defined build pipelines. A blue icon indicates a pipeline run in progress, a red icon indicates a failed pipeline run, and the green icon indicates a pipeline has succeeded.
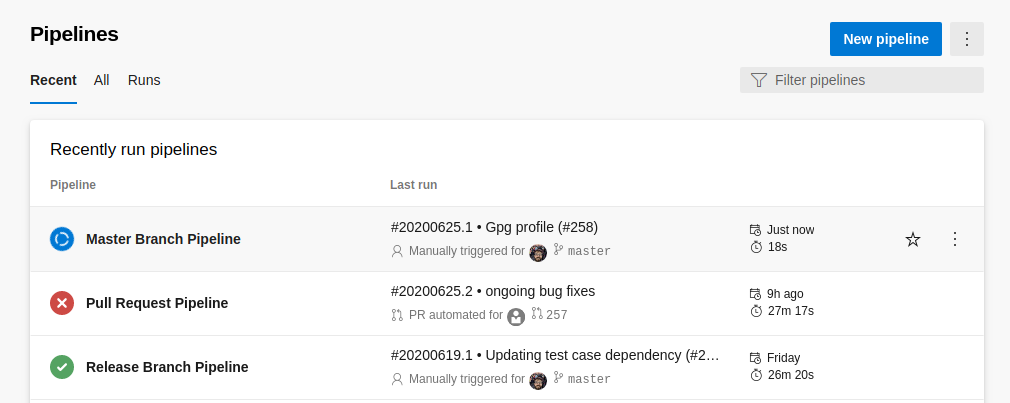
For each given pipeline, clicking on it will in turn display a historical list of all builds, and their status.
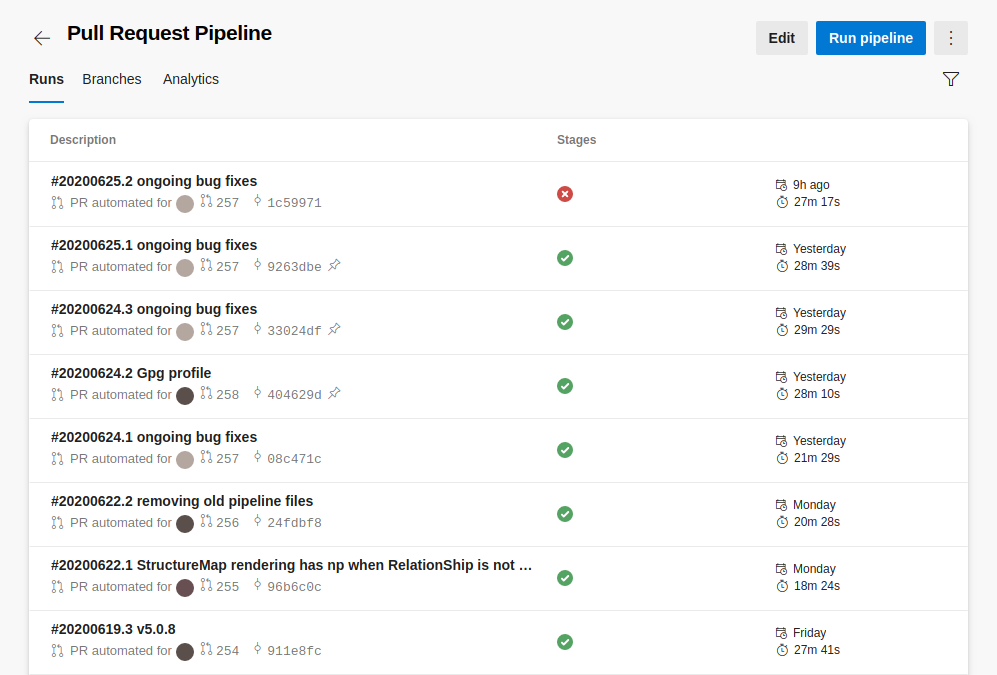
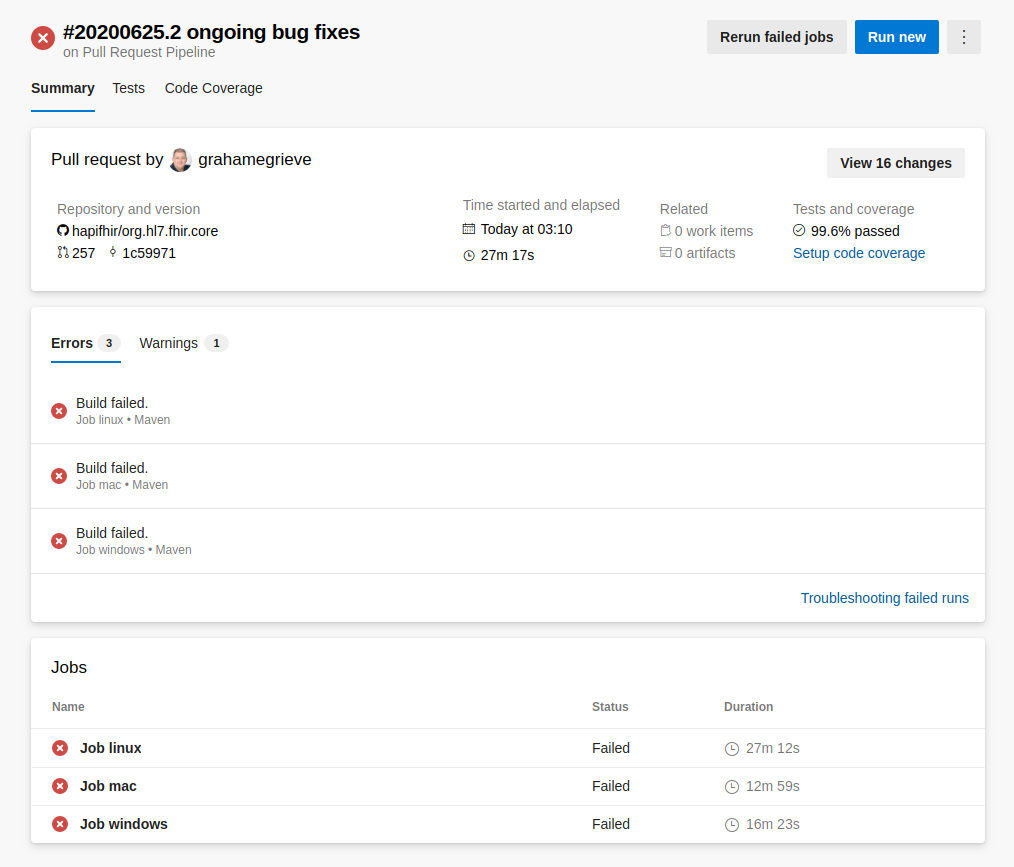
From this list, you can click on the individual runs and see the jobs that were executed as part of that specific pipeline run. For our purposes, each job usually corresponds to a given operating system we are testing against. For example, in the pull request pipeline below, we’ve run this pipeline job three times, once on linux, once on mac, and finally once on windows.

In the example above, all three jobs failed, however, this might not always be the case. If a bug is related to a specific operating system, some jobs could complete successfully, while others fail. This is actually a common occurrence, due to the nature of open source, and having users on various platforms contributing to the same codebase.
Viewing Logs
To investigate why a particular job failed, each job can be selected, and a list of tasks executed as part of that job (with corresponding logs) will be shown. For example, if we click the Job linux job from the set of failed entries, we will see the following:
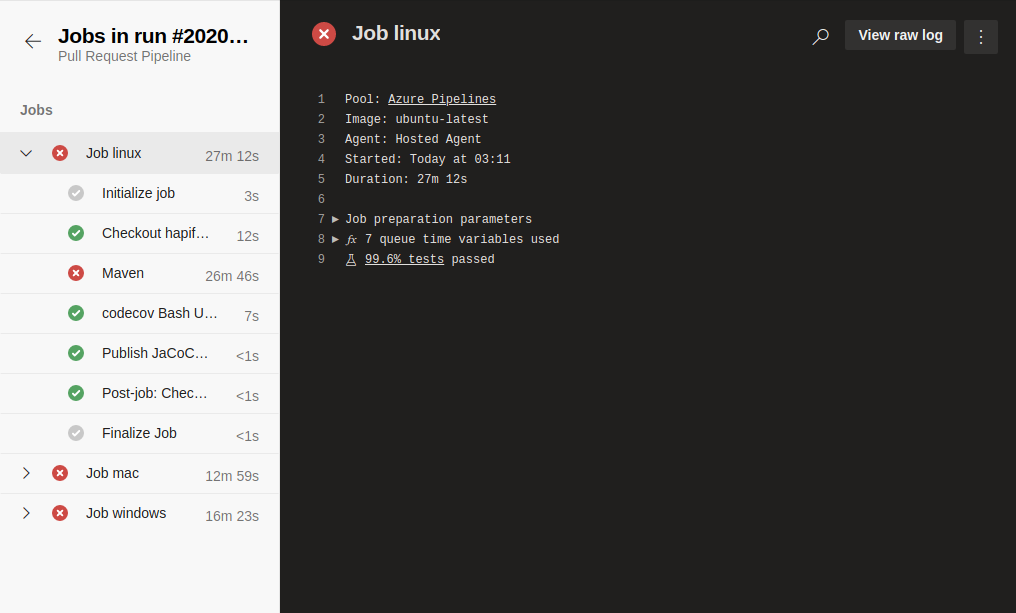
We can see there are 7 distinct entries that appear in the list of tasks here.
The first (Initialize job) and last (Finalize Job) entries are automatically added by Azure Pipelines. We have no control over them, and they are present in every pipeline we create. Their purpose is to start up, and tear down our build environment. There should never be an issue with those two steps.
Each of the other steps are ones we define for the build pipeline to execute. They each have a given name, status (in progress, success, or failure), and an execution time. To see the output log for each task, we can select it, and view the corresponding log to the right.
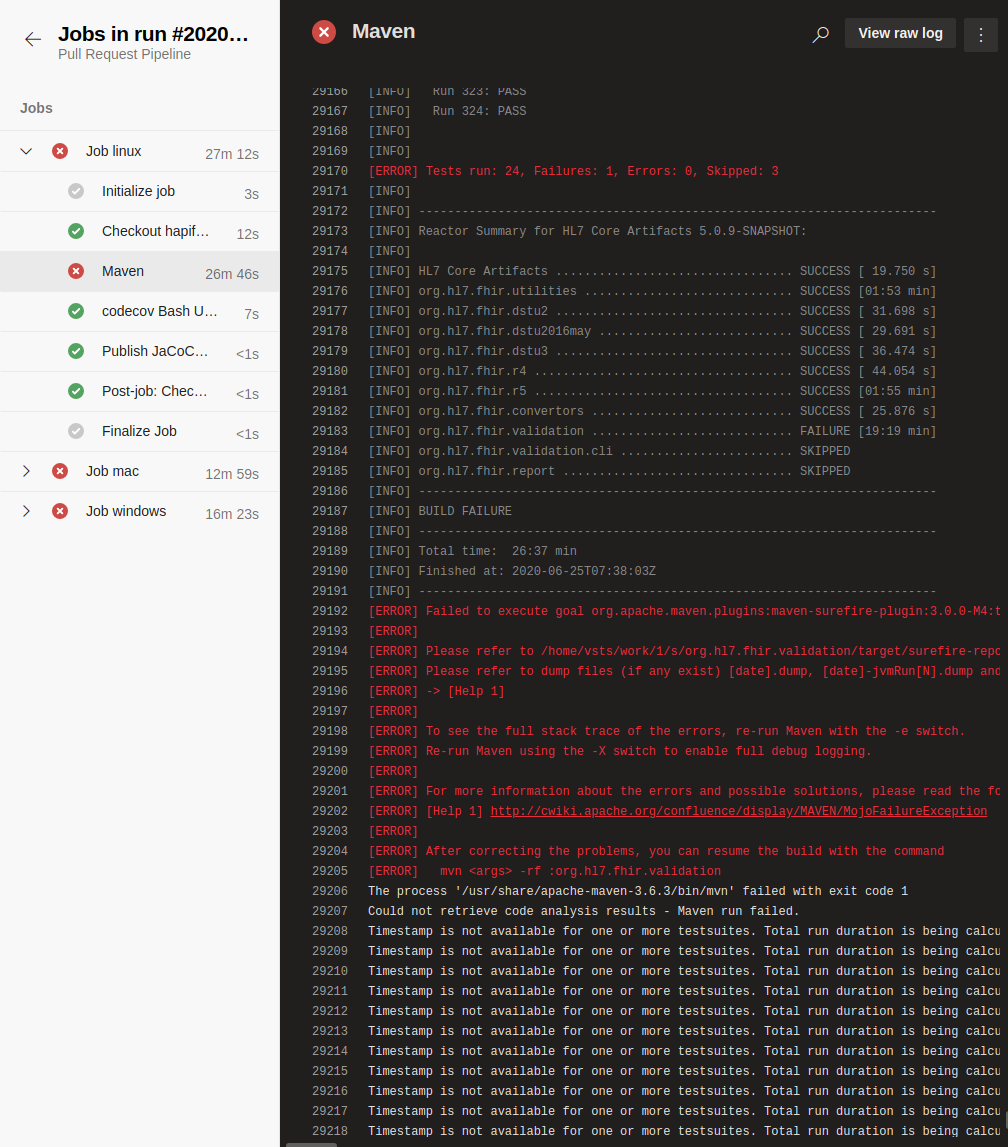
In our example above, we can see that our Maven task failed, and by selecting it, we can scroll through the log to see where the error occurred. From those logs, we see that the issue was a failed test in our org.hl7.fhir.validation package, and the error resulted from a failed test case. Once we determine the cause, we can proceed to fix the issue, or attempt to replicate it on our local machine.
External Dependency Failures & Rerunning Builds
Building the FHIR libraries requires depending on external resources, such as remote implementation guides or OSS Sonatype, for example. This is particularly apparent when building projects with more complex dependencies, such as the core project. One result of having such a reliance on network dependencies is that sometimes those resources will be unavailable at build time for one reason or another. If this happens, you may experience HTTP 408 timeouts during the build.
If you think that a build failure may be a result of a failing external dependency, and not because of a code error, you are able to manually restart the pipeline build at a later time. To do this, select the pipeline that failed, then select the failing run to display the page for that pipeline run. From there, you should see the option to “Rerun failed jobs” at the top right of the screen. Selecting this will make Azure rerun any jobs from this pipeline run that failed previously.
If you do not see the option to “Rerun failed jobs” at the top right of the screen, you need to request access to run jobs in this work space. Please reach out to David or Mark for assistance with getting these permissions.